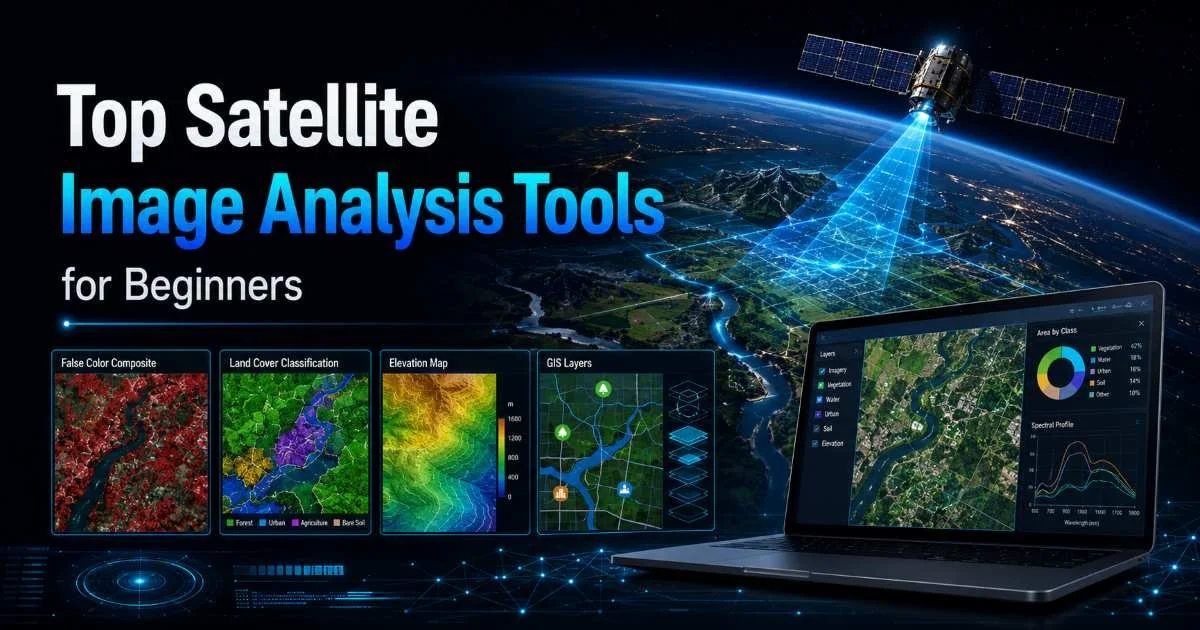
Top satellite image analysis tools for beginners can feel overwhelming to research when you're just starting out in geospatial work. The field has expanded rapidly, with dozens of platforms now offering everything from basic visualization to advanced machine learning classification. Whether you're a GIS analyst exploring new workflows or a researcher stepping into remote sensing for the first time, choosing the right tool matters.
The wrong choice can mean weeks lost learning a platform that doesn't fit your needs. This guide walks you through four practical steps to identify, compare, and start using the best beginner-friendly tools available today. If you want a foundational overview first, our complete guide on what satellite image analysis involves is a great starting point. By the end, you'll have a clear action plan for your first project.
Key Takeaways
- Free tools like QGIS and Google Earth Engine are powerful enough for professional-grade analysis.
- Cloud-based platforms reduce hardware requirements and speed up processing for large datasets.
- Start with multispectral band combinations before moving to machine learning classification workflows.
- Open-source satellite data from Sentinel-2 and Landsat covers most beginner research needs.
- Combine at least two tools to handle both visualization and quantitative analysis tasks effectively.
Step 1: Understand What You Need from an Analysis Tool
Before you download anything, define your actual requirements. Are you performing land cover classification, monitoring vegetation health, or tracking urban expansion over time? Each of these tasks demands different capabilities. A researcher studying deforestation patterns needs strong temporal analysis features, while someone mapping flood extents needs rapid visualization and band math tools. Writing down your specific goals prevents you from spending hours learning features you'll never use.
Common Use Cases for Beginners
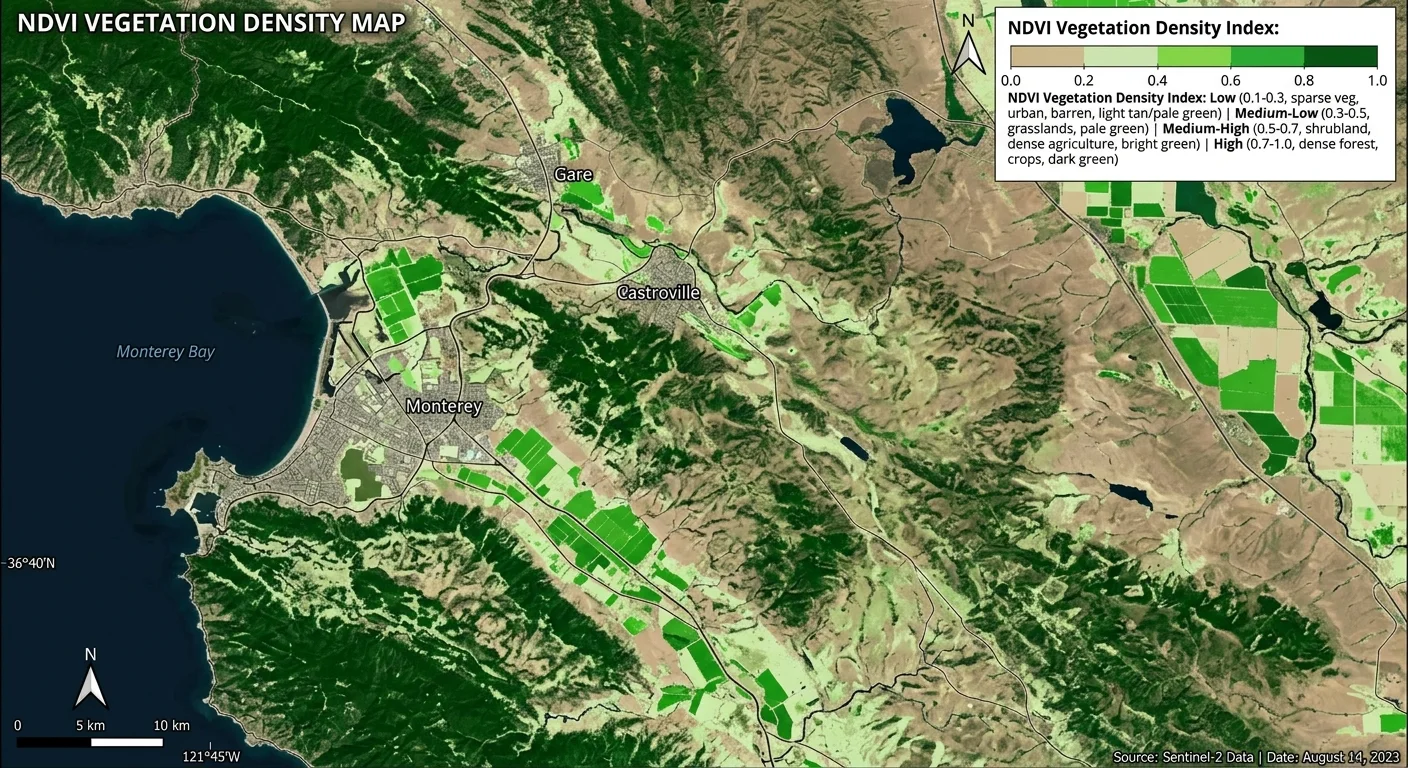
Most beginners in GIS and earth observation start with one of three workflows: visual interpretation, spectral index calculation, or supervised classification. Visual interpretation is the simplest, involving manual identification of features in imagery. Spectral indices like NDVI (Normalized Difference Vegetation Index) let you quantify vegetation density using near-infrared and red bands. Understanding how remote sensing works in satellite image analysis gives you the technical foundation to choose between these approaches confidently.
Your hardware also matters. Desktop tools like QGIS require local processing power, which can be limiting when you're working with large raster files. Cloud platforms offload computation to remote servers, making them ideal if your laptop isn't built for heavy analysis. Consider your internet connection too; cloud tools need stable bandwidth for uploading data and rendering results. Budget constraints will further narrow your options, though the best beginner tools are often completely free.
Write down your top three analysis goals before evaluating any tool. This simple step eliminates 80% of options that won't serve your needs.
Finally, think about your learning curve tolerance. Some tools have steep initial learning curves but offer far more flexibility long-term. Others get you producing maps within an hour but hit a ceiling quickly. The ideal approach for most beginners is to pick one desktop tool and one cloud platform, learning them in parallel. This gives you both offline capability and scalable processing when your datasets grow larger.
Step 2: Explore the Top Satellite Image Analysis Tools for Beginners
Free and Open-Source Options
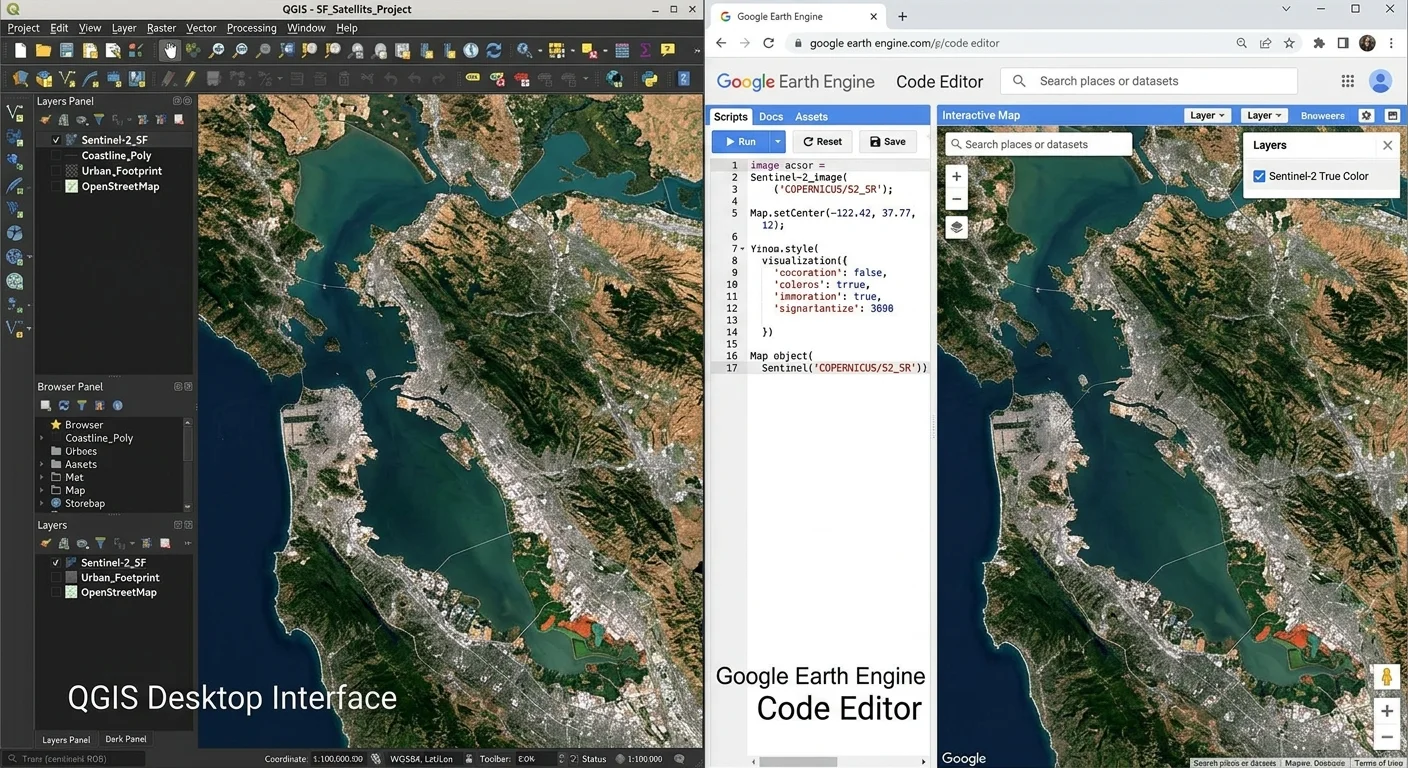
QGIS remains the gold standard for free desktop GIS and satellite image analysis. It supports raster and vector data, offers dozens of plugins for remote sensing workflows, and has an active community producing tutorials weekly. The Semi-Automatic Classification Plugin (SCP) turns QGIS into a capable image classification platform, letting you download Landsat and Sentinel-2 data directly and run supervised classification without writing code. For beginners who want a full-featured desktop environment, QGIS is hard to beat.
SNAP (Sentinel Application Platform), developed by the European Space Agency, is purpose-built for processing Sentinel satellite data. It handles radiometric calibration, atmospheric correction, and terrain correction out of the box. SNAP is particularly strong for radar (SAR) image processing, which QGIS handles less gracefully. If your research involves Sentinel-1 radar data or Sentinel-2 optical imagery, SNAP should be your first stop. The toolbox interface can feel cluttered initially, but the built-in graph processing framework lets you automate repetitive tasks once you're comfortable.
Cloud-Based Platforms
Google Earth Engine (GEE) has transformed how researchers access and analyze satellite data. Its catalog contains over 80 petabytes of imagery, including complete Landsat and Sentinel archives. You write JavaScript or Python scripts to process data on Google's servers, which means even a modest laptop can analyze decades of global imagery. GEE is free for research and education, and its code editor includes hundreds of example scripts. The learning curve involves picking up GEE's API syntax, but the payoff in processing speed is substantial.
Microsoft's Planetary Computer offers a similar cloud-based approach with access to global environmental datasets. It runs on Azure and integrates with Jupyter notebooks, making it comfortable for Python users. Sentinel Hub is another strong option, providing a REST API for on-the-fly processing of satellite imagery. When evaluating AI-powered features in these platforms, understanding what to look for in an AI coding tool helps you assess which automation features genuinely save time versus which are marketing fluff.
Step 3: Compare Features That Matter for Your Workflow
Not all tools handle the same tasks equally well. The table below compares the top satellite image analysis tools for beginners across the features that matter most for common research and GIS workflows. Pay attention to the data access column; tools with built-in data catalogs save significant time versus manually downloading imagery from separate portals.
| Tool | Cost | Built-in Data | Classification | Best For |
|---|---|---|---|---|
| QGIS + SCP | Free | Yes (via plugin) | Supervised/Unsupervised | Desktop mapping and analysis |
| SNAP | Free | Sentinel only | Limited | Sentinel data preprocessing |
| Google Earth Engine | Free (research) | 80+ PB catalog | ML classifiers | Large-scale temporal studies |
| Planetary Computer | Free | Yes (Azure) | Python libraries | Python-based research |
| Sentinel Hub | Free tier available | Sentinel + Landsat | Custom scripting | API-driven applications |
Google Earth Engine requires approval for a free research account. Apply early because approval can take several days.
Detection capabilities vary significantly between platforms. QGIS with the right plugins can perform object-based image analysis (OBIA), which groups pixels into meaningful segments before classification. GEE excels at pixel-based classification using random forests or support vector machines applied to entire image collections. If your work involves land pattern detection using satellite imagery, test both approaches to see which produces more accurate results for your specific landscape type.
Integration with other tools is another factor worth considering. QGIS connects well with R and Python through processing plugins. GEE has a dedicated Python API (geemap) that works inside Jupyter notebooks. For researchers already working in Python, tools that support scikit-learn, TensorFlow, or PyTorch for image classification workflows offer more flexibility. The ability to use large language models for image analysis is also becoming relevant as AI-assisted interpretation matures.
"The best tool is the one that fits your data, your hardware, and your deadline, not the one with the longest feature list."
Community support deserves more weight than most beginners give it. A tool with active forums, YouTube tutorials, and regularly updated documentation will accelerate your learning far more than a technically superior tool with sparse resources. QGIS and GEE both have enormous communities. SNAP's community is smaller but highly specialized. Check Stack Exchange, Reddit's r/gis, and the GIS Stack Exchange before committing to any platform, and look at how recently questions have been answered.
Step 4: Start Your First Satellite Image Analysis Project
Acquiring Your First Dataset
Sentinel-2 imagery is the best starting point for beginners. It offers 10-meter resolution in visible and near-infrared bands, revisits every five days, and is completely free. Access it through the Copernicus Open Access Hub, or download it directly within QGIS using the SCP plugin. For historical analysis stretching back to the 1980s, Landsat data from the USGS EarthExplorer portal fills that gap. Understanding the distinction between earth observation and remote sensing helps you choose the right data source for your question.
Download a single scene covering your study area rather than an entire tile mosaic. Beginners often grab too much data and spend hours on preprocessing instead of actual analysis. Pick a cloud-free scene (below 10% cloud cover) from a recent date. In GEE, you can filter image collections by cloud percentage, date range, and geographic bounds with three lines of code. This filtering step alone saves enormous amounts of time and frustration on your first project.
Running Your First Analysis
Start with a simple NDVI calculation. In QGIS, open the Raster Calculator, subtract the red band from the near-infrared band, and divide by their sum. The result is a raster layer where higher values indicate denser vegetation. This takes about five minutes and immediately shows you the power of multispectral analysis. In GEE, the same operation on a Sentinel-2 image collection covering ten years takes under thirty seconds to compute across the entire time series.
Always check your band numbering. Sentinel-2 Band 4 is red and Band 8 is NIR, but band order differs across sensors and can produce incorrect results if mixed up.
Once you've computed NDVI, try a supervised classification. Select training samples for three to five land cover classes (water, vegetation, urban, bare soil). In QGIS with SCP, draw regions of interest on the image, assign class labels, and run a maximum likelihood classification. Evaluate your results using an accuracy assessment matrix. A beginner project achieving 75% to 85% overall accuracy is a solid starting point. Document every step you take so you can reproduce or improve your workflow next time.
After your first successful classification, experiment with different algorithms and additional bands. Adding texture metrics or spectral indices as input features often improves accuracy by 5% to 10%. This iterative process of testing, evaluating, and refining is the core of satellite image analysis work. Each iteration teaches you something new about both the software and the landscape you're studying, building skills that transfer across any platform you use in the future.
Final Thoughts
Finding the top satellite image analysis tools for beginners comes down to matching your goals, hardware, and learning style to the right platform. QGIS and Google Earth Engine cover most beginner needs without any cost.
Start with a simple NDVI project, progress to supervised classification, and expand your toolkit as your questions grow more complex. The satellite imagery field rewards hands-on experimentation far more than passive reading, so open a tool today and load your first scene.
Disclaimer: Portions of this content may have been generated using AI tools to enhance clarity and brevity. While reviewed by a human, independent verification is encouraged.