Satellite image analysis is the process of extracting meaningful information from imagery captured by Earth-observing satellites to understand land patterns, detect visible objects, track location changes, interpret map signals, assess environmental features, and describe visual area details. For GIS analysts and researchers, this discipline sits at the intersection of computer science, geography, and environmental science.
It transforms raw overhead pixels into actionable intelligence that supports everything from urban planning to disaster response. The field has matured dramatically in the past decade, driven by increased satellite revisit rates, higher spatial resolutions, and the integration of artificial intelligence.
Whether you're monitoring deforestation in the Amazon or mapping impervious surfaces in a growing metro area, satellite image analysis provides the foundational layer of evidence. Understanding what it is, how it works, and where it applies will sharpen your ability to extract value from geospatial data.
Key Takeaways
- Satellite image analysis converts raw orbital imagery into structured geospatial intelligence for decision-making.
- Multispectral and SAR sensors each reveal different land surface characteristics worth combining.
- Change detection algorithms can identify land use shifts across timeframes as short as days.
- Environmental monitoring relies heavily on vegetation indices derived from spectral band math.
- AI-powered classification now achieves over 90% accuracy for common land cover categories.
How Satellite Image Analysis Works
Sensor Types and Data Acquisition
The process begins with remote sensing platforms orbiting Earth at altitudes typically between 400 and 36,000 kilometers. Optical sensors capture reflected sunlight across visible and infrared wavelengths, while synthetic aperture radar (SAR) systems emit their own microwave pulses and measure the return signal. This distinction matters because SAR can penetrate cloud cover and operate at night, making it indispensable for tropical regions or time-sensitive monitoring. The choice of sensor directly shapes what information you can extract from the resulting imagery.
Multispectral sensors like those on Landsat 8/9 or Sentinel-2 record data in discrete spectral bands, each sensitive to different surface properties. The near-infrared band, for instance, is highly reflective off healthy vegetation but absorbed by water. Hyperspectral sensors push this further, capturing hundreds of narrow bands that can distinguish mineral compositions or crop stress levels. Resolution varies widely; commercial satellites like WorldView-3 offer 31-centimeter panchromatic resolution, while free Sentinel-2 data provides 10-meter pixels across key bands.
Processing Pipeline
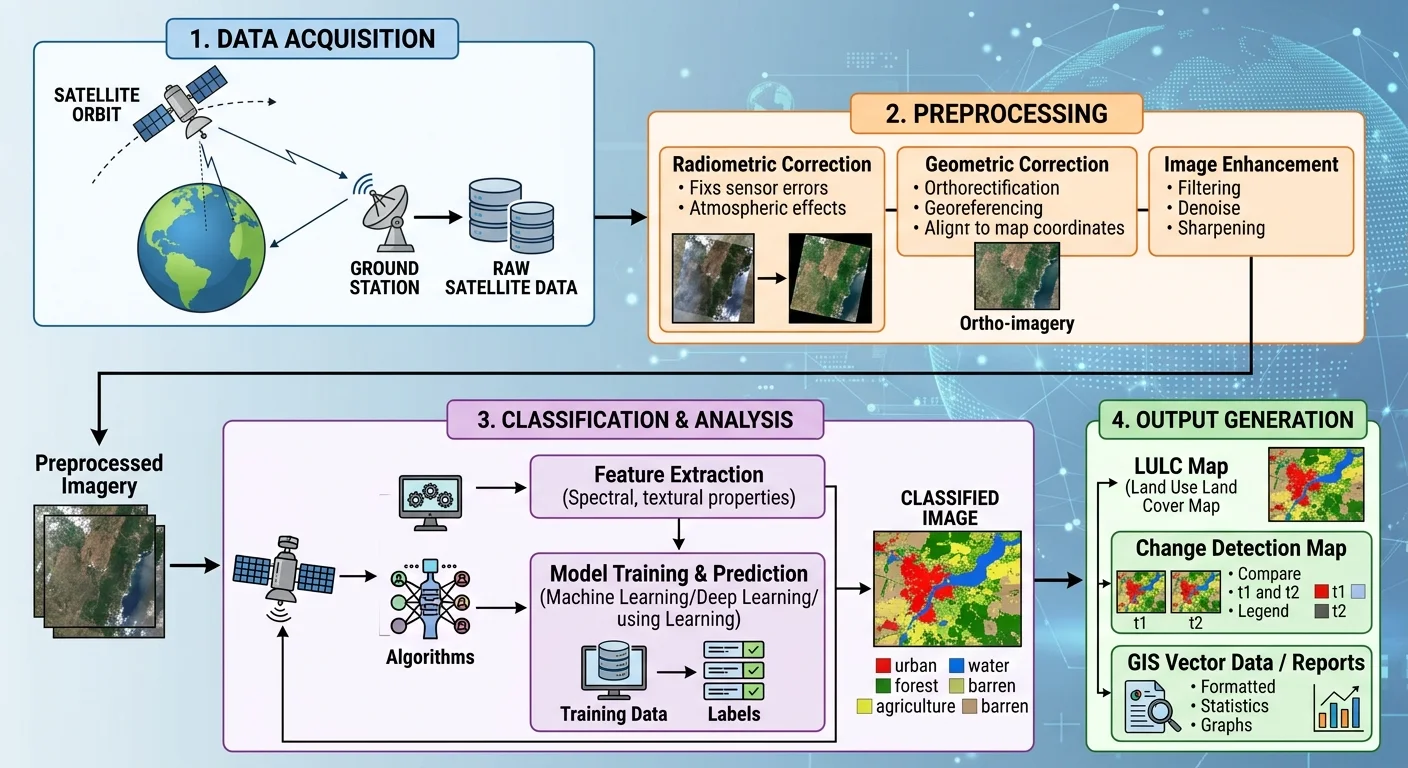
Raw satellite data requires significant preprocessing before analysis. Radiometric calibration converts digital numbers to physical reflectance values, while geometric correction aligns pixels to real-world coordinates. Atmospheric correction removes the scattering and absorption effects of gases and aerosols between the sensor and the ground. These steps are not optional; skipping them introduces systematic errors that propagate through every downstream product. Most analysts rely on established toolchains within platforms like ENVI, ERDAS IMAGINE, or open-source QGIS with Orfeo ToolBox plugins.
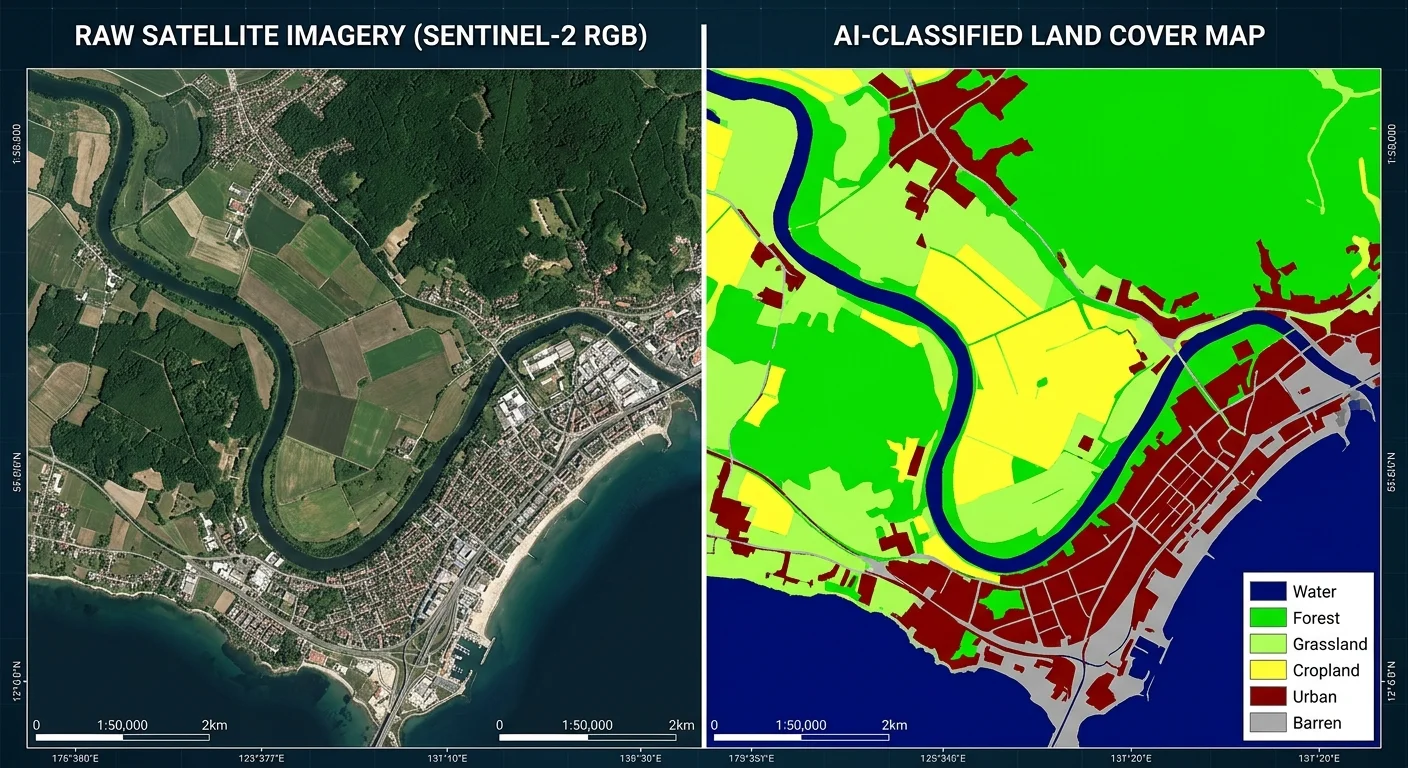
After preprocessing, analysts apply classification algorithms, spectral indices, or object-based image analysis to extract features. Supervised classification trains models on labeled training samples, while unsupervised methods like K-means clustering group pixels by spectral similarity without prior labels. Modern deep learning approaches, particularly convolutional neural networks, have pushed classification accuracy beyond what traditional methods achieve. The advantages of satellite imagery compared to other data sources become especially clear when you need consistent, repeatable coverage over large areas.
Always validate your classification results against ground truth data or higher-resolution reference imagery to quantify accuracy.
Why It Matters: Use Cases Across Disciplines
Urban and Agricultural Applications
Land use mapping ranks among the most common applications of geospatial analysis with satellite data. Urban planners use classified imagery to track sprawl, identify informal settlements, and model heat island effects. Agricultural researchers monitor crop health through normalized difference vegetation index (NDVI) time series, detecting irrigation failures or pest outbreaks weeks before they become visible to the naked eye. These applications depend on the temporal consistency that satellites uniquely provide, revisiting the same location on predictable schedules.
Precision agriculture has adopted aerial imagery interpretation at scale. Farmers and agronomists compare multitemporal composites to identify within-field variability, optimizing fertilizer application and irrigation. One study across the U.S. Corn Belt showed that satellite-derived management zones reduced nitrogen application by 15% while maintaining yield. The economic and environmental returns compound when applied across millions of hectares. This kind of evidence-based farming simply was not feasible before satellite revisit rates dropped below five days with constellations like Sentinel-2.
Disaster Response and Security
Environmental monitoring during natural disasters depends on rapid satellite tasking and analysis. After the 2023 earthquakes in Turkey and Syria, Copernicus Emergency Management Service activated within hours, producing damage grading maps from before-and-after imagery. Flood extent mapping using SAR data from Sentinel-1 became a standard product for humanitarian coordination. These outputs guide resource allocation when ground access is limited or dangerous, and they provide an objective baseline for insurance and reconstruction assessments.
Security and defense organizations use satellite image analysis to monitor border activity, track vessel movements, and detect construction at sensitive sites. Commercial providers like Maxar and Planet have made this capability accessible beyond government agencies. Open-source intelligence (OSINT) communities now routinely use freely available imagery to verify conflict reports. The democratization of this technology raises both opportunity and ethical responsibility for researchers working in these spaces.
"The democratization of satellite imagery raises both tremendous opportunity and serious ethical responsibility for the research community."
Real Examples and Common Misconceptions
Concrete Case Studies
Brazil's PRODES program has used Landsat imagery since 1988 to measure annual deforestation in the Legal Amazon. This three-decade time series represents one of the most sustained applications of satellite image analysis for environmental policy. The data directly informs enforcement actions and has been credited with helping reduce deforestation rates by over 70% between 2004 and 2012. When political will weakened and rates climbed again after 2019, the same satellite record provided undeniable evidence of the reversal.
In urban contexts, the European Urban Atlas uses satellite-derived land cover maps at 2.5-meter resolution for over 800 European cities. Planners use these maps to assess green space accessibility, model transportation demand, and plan infrastructure investments. Similarly, NASA's GRACE satellite mission (now GRACE-FO) measures gravitational anomalies to infer groundwater depletion, a form of satellite analysis that goes beyond visible imagery into geophysical signal interpretation. These examples show the breadth of what falls under geospatial analysis from space.
Not all satellite analysis involves visible light imagery; gravitational, thermal, and radar data each reveal different Earth system processes.
Misconceptions Worth Correcting
A persistent misconception is that satellite imagery provides real-time surveillance. In reality, most Earth observation satellites have revisit times measured in days, and tasking commercial satellites for a specific target requires advance coordination and significant cost. Another common misunderstanding is that higher resolution always means better analysis. For regional land cover classification, Sentinel-2's 10-meter resolution often outperforms very high resolution imagery because the spectral information in its 13 bands compensates for the coarser spatial detail.
Some newcomers also assume that satellite imagery is inherently accurate. Every image contains noise, atmospheric artifacts, cloud shadows, and geometric distortions. The quality of your analysis depends heavily on your preprocessing rigor and your understanding of sensor limitations. Treating satellite data as ground truth without validation is a methodological error that can produce misleading results. Much like reducing technical debt in software projects, addressing data quality issues early prevents compounding errors downstream.
| Satellite/Sensor | Spatial Resolution | Revisit Time | Spectral Bands | Primary Use |
|---|---|---|---|---|
| Sentinel-2 (MSI) | 10 m | 5 days | 13 | Land cover mapping |
| Landsat 9 (OLI-2) | 30 m | 16 days | 11 | Long-term monitoring |
| WorldView-3 | 0.31 m | 1 day (tasked) | 29 | Detailed feature extraction |
| Sentinel-1 (SAR) | 5 m | 6 days | C-band SAR | Flood and deformation mapping |
| Planet SkySat | 0.5 m | Daily | 4 | Rapid change detection |
Related Concepts and Tools
Connecting Disciplines
Satellite image analysis does not exist in isolation. It overlaps substantially with photogrammetry (extracting 3D measurements from stereo imagery), LiDAR analysis (using laser altimetry for elevation modeling), and GIS-based spatial analysis. Remote sensing provides the raw observational data, while GIS supplies the framework for integrating that data with cadastral records, infrastructure databases, and socioeconomic layers. Understanding where these disciplines intersect helps analysts choose the right tool for each question rather than forcing satellite data into problems better served by other methods.
Aerial imagery interpretation from drones and aircraft complements satellite analysis for site-specific investigations. Drones provide centimeter-level resolution on demand but cover limited areas. Satellites cover entire countries in a single pass but at coarser detail. The optimal workflow often combines both: satellite data for screening and prioritization, followed by drone missions for detailed inspection. This tiered approach is standard practice in mining, forestry, and infrastructure inspection.
Combine satellite and drone imagery in a tiered workflow to balance spatial coverage with the detail needed for site-level decisions.
AI and Automation in the Workflow
Machine learning has reshaped satellite image analysis workflows profoundly. Pre-trained models for building footprint extraction, road network mapping, and crop type classification are now available through platforms like Google Earth Engine, Microsoft Planetary Computer, and various open-source repositories. Exploring the best large language models for image analysis reveals how multimodal AI systems are beginning to interpret satellite scenes in natural language, opening new possibilities for non-specialist users.
Automation reduces the manual burden of repetitive geospatial tasks. Automating repetitive tasks for team productivity applies directly to GIS workflows where analysts run identical processing chains across hundreds of tiles. Similarly, well-structured analysis code benefits from the same principles that guide clean code development. As your geospatial projects grow, maintaining organized, documented pipelines becomes essential. Even your project's online visibility matters; understanding how backlink analysis strengthens domain authority can help research teams share their satellite analysis tools and findings with wider audiences.
AI models trained on imagery from one geographic region may perform poorly in others due to spectral and contextual differences. Always retrain or fine-tune for your study area.
Frequently Asked Questions
?How do I choose between Sentinel-2 and WorldView-3 for my project?
?When should I use SAR imagery instead of optical sensors?
?How long does preprocessing a satellite image pipeline actually take?
?Does AI classification really hit 90% accuracy across all land cover types?
Final Thoughts
Satellite image analysis has moved from a niche specialization to a foundational capability for any researcher or analyst working with geographic data. The combination of freely available imagery, mature processing tools, and AI-driven classification makes it more accessible than ever.
What separates strong analysis from superficial outputs is the analyst's understanding of sensor physics, preprocessing requirements, and validation protocols. Invest time in those fundamentals, and the expanding constellation of Earth observation satellites will keep delivering richer, more frequent data for years to come.
Disclaimer: Portions of this content may have been generated using AI tools to enhance clarity and brevity. While reviewed by a human, independent verification is encouraged.