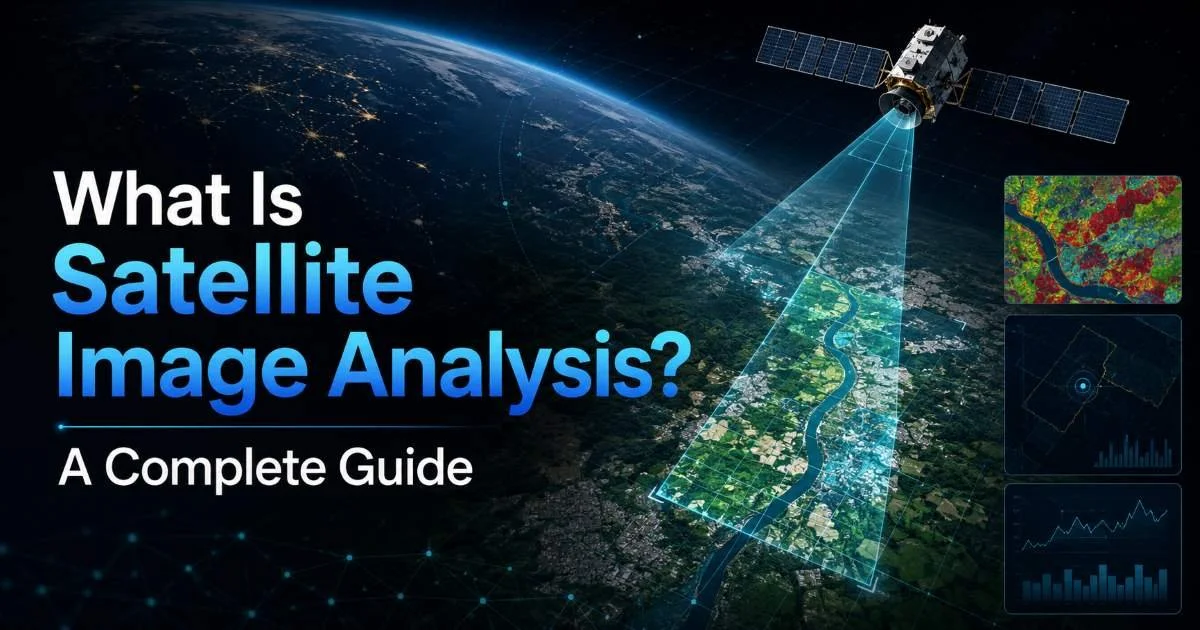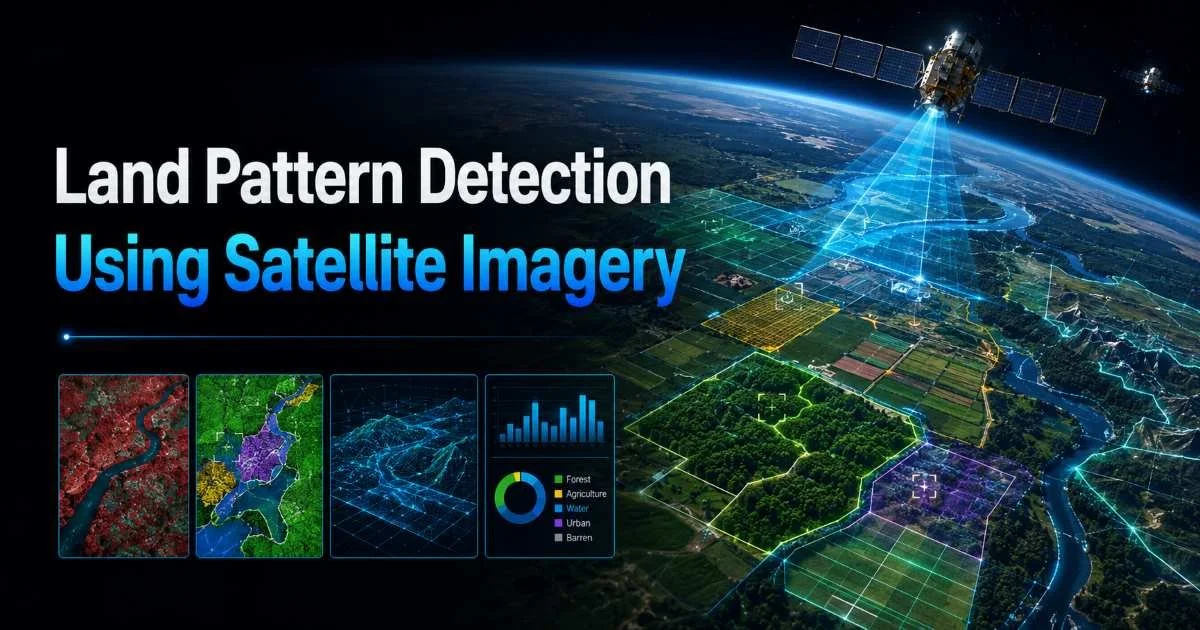
Land pattern detection using satellite imagery has become a foundational practice for GIS analysts and researchers who need to understand how terrain, vegetation, urban sprawl, and agricultural zones evolve over time. Whether you're tracking deforestation in the Amazon or monitoring suburban expansion around a growing city, the ability to identify and classify land patterns from orbital data directly shapes policy decisions and environmental management.
This guide walks you through a practical, step-by-step workflow for detecting land patterns using satellite data. You'll learn how to select the right imagery, preprocess it for accuracy, apply classification algorithms, and validate your results.
The stakes are real: poor pattern detection leads to flawed models, misallocated resources, and missed environmental threats. By following these steps, you can build a repeatable workflow grounded in satellite image analysis best practices. Let's get into the specifics.
Key Takeaways
- Multispectral imagery with at least four bands produces the most reliable land classification results.
- Atmospheric and geometric corrections are non-negotiable preprocessing steps before any analysis.
- Supervised classification outperforms unsupervised methods when sufficient ground truth data exists.
- Accuracy assessment requires a confusion matrix with at least 50 samples per class.
- Combining GIS mapping tools with remote sensing data improves pattern detection accuracy significantly.
Step 1: Select and Acquire the Right Satellite Imagery
Choosing Spatial and Spectral Resolution
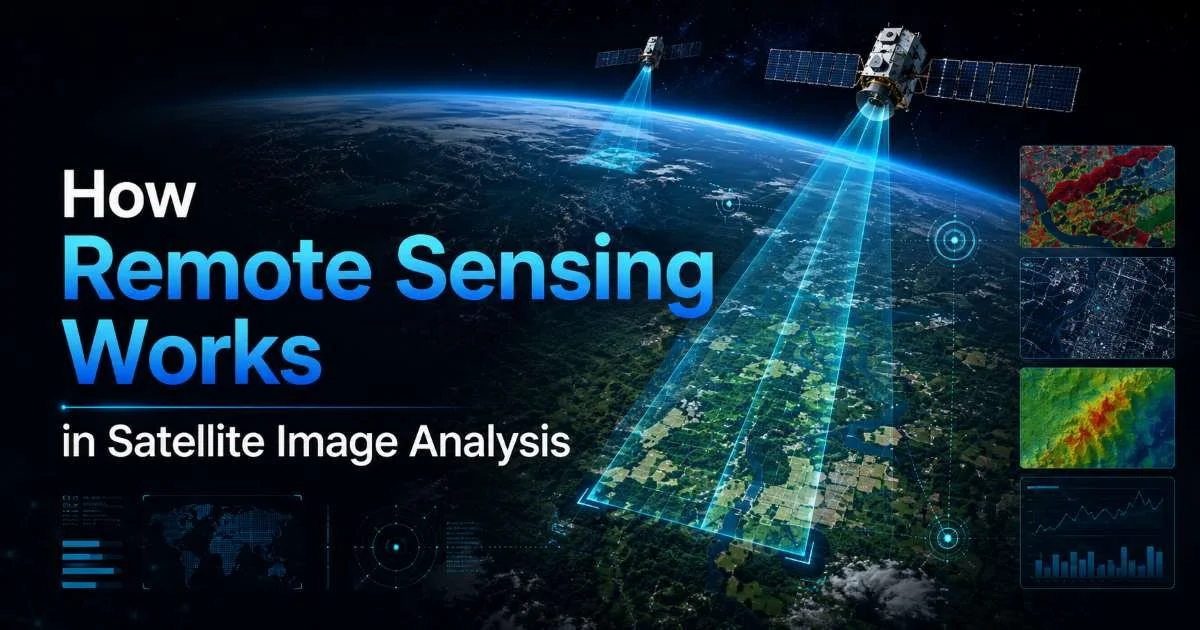
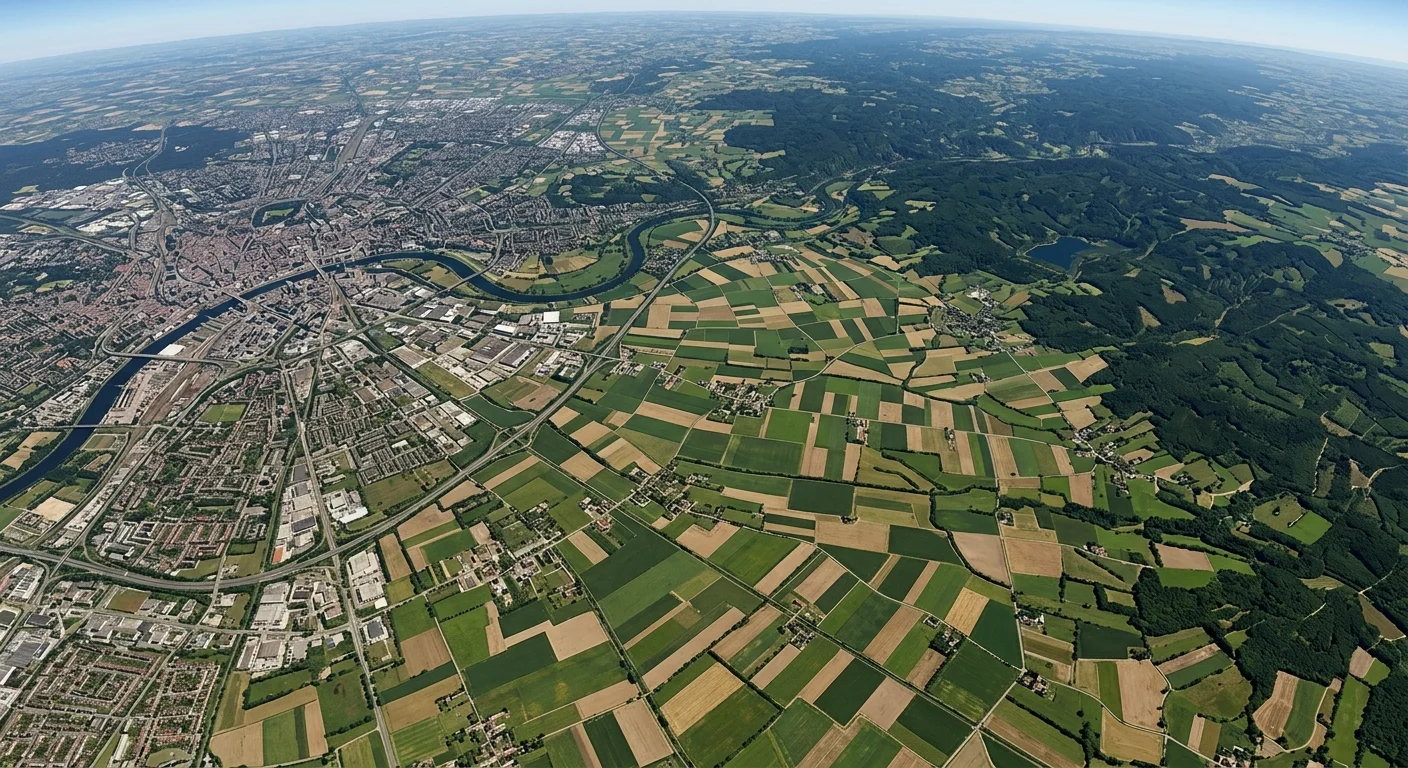
Your choice of satellite imagery determines the ceiling for everything that follows. For land pattern detection using satellite imagery, you need to match the sensor's spatial resolution to your project's scale. A national-level land cover study works well with 30-meter Landsat data, while urban morphology research typically demands sub-meter imagery from sensors like WorldView-3 or Pléiades. Understanding how remote sensing works in satellite image analysis will help you make this decision confidently.
Spectral resolution matters just as much as spatial resolution. Four-band imagery (red, green, blue, near-infrared) is the baseline for vegetation and water discrimination. Sensors offering shortwave infrared bands, like Sentinel-2's 13-band configuration, let you distinguish between crop types, soil moisture levels, and mineral compositions that look identical in visible light. Always check whether your use case benefits from additional spectral information before defaulting to the cheapest option.
Temporal resolution is the third factor. If you're studying seasonal agricultural patterns, you need imagery at regular intervals throughout the growing cycle. Sentinel-2 provides a five-day revisit time at the equator, which is excellent for change detection. Landsat offers a 16-day cycle. For one-time mapping projects, temporal cadence is less important, but for dynamic land pattern detection, it's a core requirement.
Recommended Data Sources
Several free and commercial platforms provide high-quality satellite data. The USGS Earth Explorer portal hosts the entire Landsat archive. The Copernicus Open Access Hub distributes Sentinel data. Google Earth Engine provides cloud-based access to petabytes of earth observation datasets. For commercial needs, Maxar and Planet Labs offer tasking services that capture specific areas on demand. Match your budget to the resolution and coverage your project demands.
| Platform | Spatial Resolution | Revisit Time | Cost | Best For |
|---|---|---|---|---|
| Landsat 8/9 | 30 m (15 m pan) | 16 days | Free | Regional land cover |
| Sentinel-2 | 10 m | 5 days | Free | Agriculture, vegetation |
| WorldView-3 | 0.31 m | 1 to 4 days | Commercial | Urban mapping |
| Planet (Dove) | 3 m | Daily | Commercial | Change detection |
| MODIS | 250 m | 1 to 2 days | Free | Large-scale monitoring |
Start with free Sentinel-2 data for prototyping your workflow before investing in commercial imagery.
Step 2: Preprocess Your Satellite Data
Atmospheric and Radiometric Correction
Raw satellite imagery contains distortions from the atmosphere, sensor geometry, and sun angle variations that will corrupt your analysis if left uncorrected. Atmospheric correction converts top-of-atmosphere radiance to surface reflectance, removing the scattering and absorption effects of aerosols and water vapor. Tools like Sen2Cor (for Sentinel-2) and the USGS LaSRC algorithm (for Landsat) automate this process. Without this step, two images captured on different days will produce inconsistent spectral signatures for the same ground cover.
Radiometric calibration standardizes the digital numbers recorded by the sensor into physically meaningful units. This is particularly important when comparing images from different sensors or different time periods. The difference between earth observation and remote sensing approaches becomes relevant here, as each method may require different calibration parameters depending on the sensor and data product level.
Skipping atmospheric correction will produce classification errors of 10 to 25 percent, especially in areas with high aerosol concentrations.
Geometric Correction and Mosaicking
Geometric correction aligns your satellite image to a known coordinate system so that pixel locations correspond to actual ground positions. This involves orthorectification using a digital elevation model (DEM) to remove terrain-induced distortions. SRTM 30-meter DEMs work well for moderate-resolution imagery. For sub-meter data, you'll need higher-resolution DEMs or lidar-derived surfaces. GIS software like QGIS and ArcGIS Pro both offer robust orthorectification tools.
When your study area spans multiple satellite scenes, you'll need to mosaic them into a single composite. Color balancing across scenes prevents visible seam lines that can confuse classification algorithms. Apply histogram matching or dodging techniques to equalize brightness and contrast. After mosaicking, clip the composite to your area of interest to reduce processing time and file size. This is also the stage where you should mask clouds and cloud shadows using quality assessment bands included with most satellite products.
Sentinel-2 Level-2A products come pre-corrected for atmosphere, saving significant preprocessing time compared to Level-1C products.
Step 3: Apply Classification Algorithms for Land Pattern Detection
Supervised vs. Unsupervised Classification
Land pattern detection using satellite imagery relies heavily on how you classify pixels into meaningful categories. Supervised classification uses training samples you define, where you manually delineate representative areas for each land cover class (forest, water, urban, agriculture, barren). The algorithm then assigns every pixel in the image to the class it most closely resembles. Maximum Likelihood, Support Vector Machines (SVM), and Random Forest are the three most common supervised classifiers. Random Forest consistently performs well across diverse landscapes, handling noise and mixed pixels better than Maximum Likelihood.
Unsupervised classification, by contrast, groups pixels into clusters based on spectral similarity without any training data. Algorithms like K-Means and ISODATA are fast to run and useful for initial exploration. However, you still need to label the resulting clusters manually, and the output often splits single land cover types into multiple classes or merges distinct types together. Use unsupervised methods for preliminary assessment, then switch to supervised classification for your final product.
Advanced Methods and Tools
Deep learning has pushed the boundaries of land pattern detection using satellite imagery beyond what traditional pixel-based methods can achieve. Convolutional Neural Networks (CNNs), particularly U-Net architectures, perform semantic segmentation that classifies every pixel while respecting spatial context. This means the algorithm understands that a group of bright pixels surrounded by vegetation is likely a building, not bare soil. Frameworks like TensorFlow and PyTorch, combined with libraries like Rasterio and GDAL, make it practical to train these models on standard hardware. The principles behind AI-based visual detection, similar to those used in smart AI detection systems, apply directly to satellite-based classification tasks.
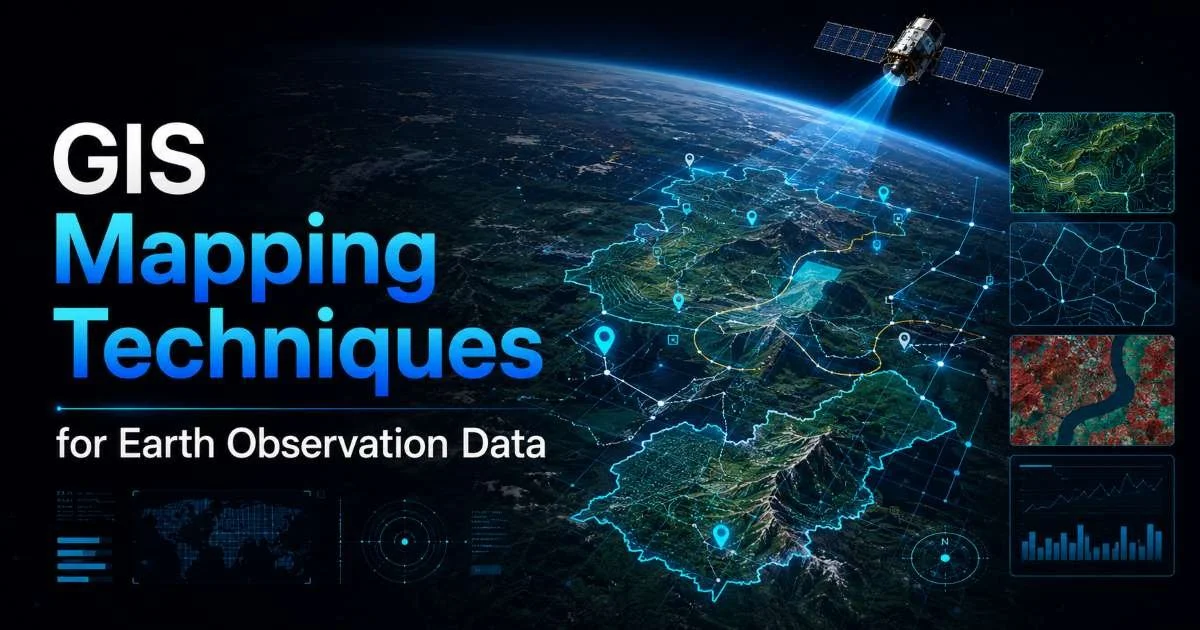
Object-Based Image Analysis (OBIA) is another powerful approach that segments the image into homogeneous objects before classification. Instead of classifying individual pixels, OBIA classifies regions based on spectral, spatial, and textural properties. This reduces the "salt and pepper" noise common in pixel-based results. Software like eCognition and Orfeo ToolBox support OBIA workflows. When combined with GIS mapping techniques for earth observation data, OBIA produces clean, cartographically meaningful outputs ready for stakeholder presentation.
"The shift from pixel-based to object-based and deep learning methods has transformed land pattern detection from a manual art into a scalable, reproducible science."
Step 4: Validate and Refine Your Detection Results
Accuracy Assessment Techniques
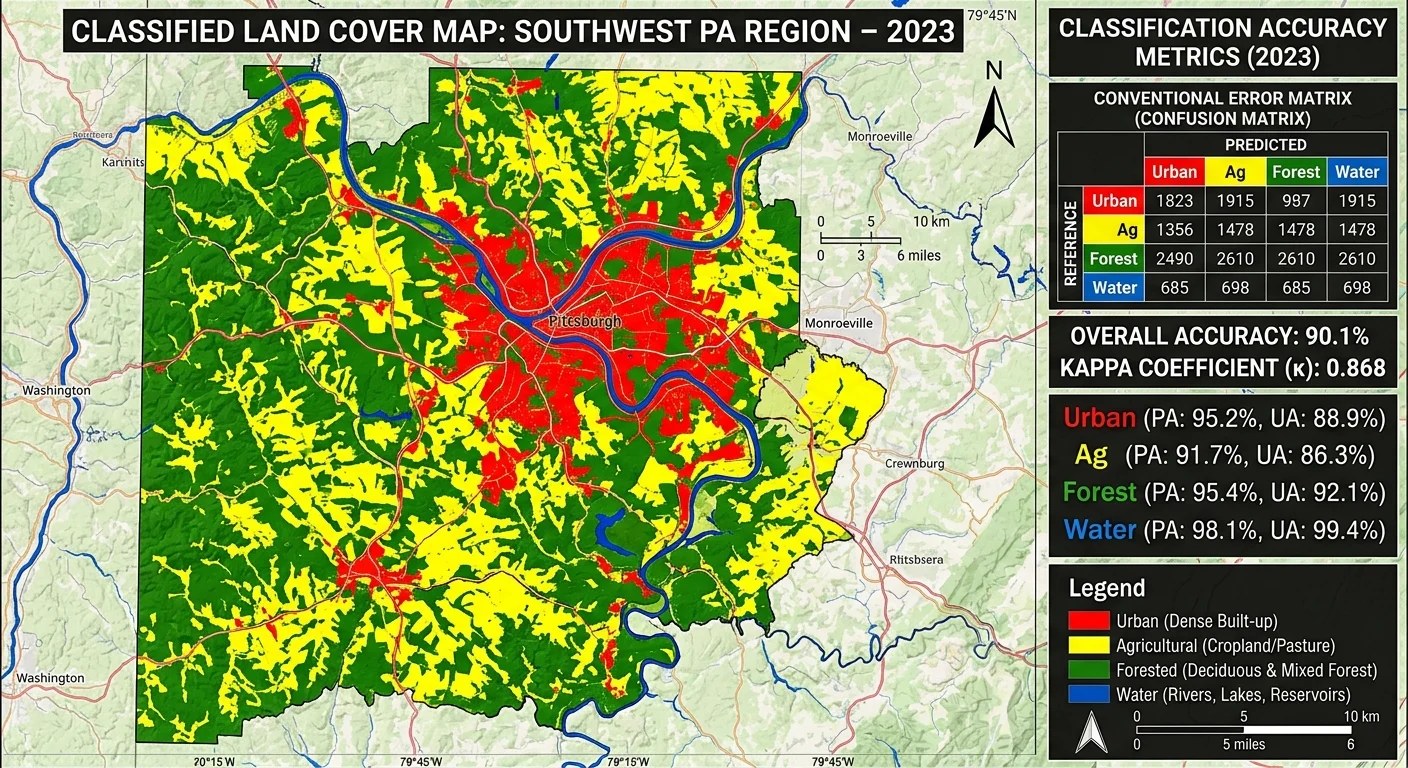
A land cover map without accuracy assessment is just a colorful picture. You need to quantify how well your classification matches reality. The standard approach builds a confusion matrix (also called an error matrix) by comparing classified pixels against ground truth reference data. Collect reference points from field surveys, high-resolution imagery (Google Earth Pro works well), or existing validated datasets. The general recommendation is at least 50 reference points per class, though more complex landscapes demand 75 to 100.
From the confusion matrix, calculate overall accuracy, producer's accuracy (how well the map represents each class), user's accuracy (how reliable each mapped class is), and the Kappa coefficient. An overall accuracy above 85 percent is generally considered acceptable for publication. If specific classes fall below 75 percent, investigate why. Common culprits include spectral confusion between similar classes (like grassland and cropland), insufficient training samples, or cloud shadow contamination that slipped through preprocessing.
Consider also how concerns around AI tools and data privacy may affect your workflow, particularly if your analysis involves identifiable properties or integrates third-party datasets with personal information. Responsible handling of sensitive spatial data is increasingly expected in research and commercial projects alike.
Use stratified random sampling for reference points to avoid overrepresenting dominant land cover classes in your accuracy assessment.
Iterating and Publishing
Validation rarely succeeds on the first pass. When accuracy falls short, revisit your training data first. Add more samples in areas where confusion between classes is highest. Adjust your feature space by incorporating spectral indices like NDVI, NDWI, or NDBI. Texture features derived from Grey-Level Co-occurrence Matrices (GLCM) can separate classes that look spectrally identical but differ in surface roughness, such as old-growth forest versus plantation. Each refinement cycle should improve your numbers measurably.
Once your classification meets accuracy thresholds, prepare the output for sharing. Export as GeoTIFF for raster workflows or convert to vector polygons for GIS integration. Include metadata documenting your sensor, preprocessing steps, classifier, training sample sizes, and accuracy metrics. Reproducibility is non-negotiable in professional analysis. Modern tools for AI-assisted content workflows can help you document and communicate your methodology clearly when writing up results for reports or publications.
Frequently Asked Questions
?How do I apply atmospheric correction before classifying Sentinel-2 data?
?When should I use unsupervised classification instead of supervised?
?How long does building a repeatable land pattern detection workflow typically take?
?Is using only RGB bands sufficient for detecting agricultural land patterns?
Final Thoughts
Land pattern detection using satellite imagery is a structured process that rewards careful preparation and methodical execution. Every step, from image selection through validation, directly impacts the quality of your final product.
The tools available today, from free Sentinel-2 data to open-source deep learning frameworks, make professional-grade analysis accessible to any GIS analyst willing to invest the effort. Build your workflow iteratively, document every decision, and never skip accuracy assessment. The patterns you detect will only be as trustworthy as the process that produced them.
Disclaimer: Portions of this content may have been generated using AI tools to enhance clarity and brevity. While reviewed by a human, independent verification is encouraged.